State of the U.S. Unions 2022
This is my annual roundup of labor data on union membership, elections and strikes. How is the labor movement doing?
At the beginning of each year a bunch of annual U.S. union data is released, and this is a good time to see what it tells us about how the labor movement is doing. We’ll examine data on union membership, NLRB elections, BLS large strike data, and other strike data that is available. My summary from last year can be found here.
Union Membership
In January, the U.S. Bureau of Labor Statistics (BLS) released its annual Union Members summary. The labor movement membership and membership rate were both down, a depressing annual reminder that we’re not doing well enough. As the BLS states,
In 2021, the number of wage and salary workers belonging to unions continued to decline (-241,000) to 14.0 million, and the percent who were members of unions — the union membership rate — was 10.3 percent, the U.S. Bureau of Labor Statistics reported today. The rate is down from 10.8 percent in 2020 — when the rate increased due to a disproportionately large decline in the total number of nonunion workers compared with the decline in the number of union members. The 2021 unionization rate is the same as the 2019 rate of 10.3 percent.
Both the private and public sectors saw slight decreases in union density — the private sector down from 6.3% to 6.1%, and the public sector down from 34.8% to 33.9%. The rate for all workers covered by collective bargaining agreements, which also includes non members, is slightly higher for all these numbers.
Particularly alarming is that union membership has such a limited geographic distribution. Almost half of all union members are in just six states (CA, NY, IL, PA, WA, NJ), and 10 states have union membership rates less than 5% (AR, GA, ID, LA, NC, SC, SD, TX, UT, VA). The labor movement is not spread out enough and has too small a presence in too many states. One consequence is that elected officials in many states face no consequences when voting against worker and union interests.
Here’s a chart showing the union density trend for the last century. The density decline has been happening since its peak in the 1950s. Moreover, private sector union density is where it was in the early 1900s. This decline has contributed to the rise of wealth inequality in the last half century.

Union Elections
The National Labor Relations Board (NLRB) oversees most union elections in the private sector. It releases its annual Election Reports shortly after the federal fiscal year ends, which runs from Oct to the following September. The 2021 report shows that the number of union-instigated elections (called RC elections) was 840, with a 61% win rate.
This is the second year in a row that the number of NLRB RC elections has fallen below 1,000. Though this has likely been impacted by the COVID-19 pandemic, the falling trend for decades has been clear, and we are seeing the lowest number of NLRB elections since the early days of the National Labor Relations Act (NLRA) in the late 1930s. I discuss that more here. Here’s the election trend and win rate for the last 20 years.

We can see the number of annual elections drop in the last two decades, with a 59% decrease from the three year periods 2001–2003 to 2019–2021. The number of annual elections used to be many times this, typically 8,000 or more in the 1970s. However, the union win rate was lower back then, in the 50% range. So whereas the number of elections has gone down dramatically, the win rate has improved, averaging about 65% in the last three years. Unions have gotten much better at winning elections, but unfortunately are just running too few of them. I have previously discussed some of the dynamics of more successful organizing campaigns.
One major consequence of this election decline is that many fewer workers have the opportunity to vote in a union election. We have a 66% drop in the number of workers voting, from the three year periods 2001–2003 to 2019–2021. From the 1950s through the 1970s, an average of about 500,000 private sector workers participated in NLRB elections every year, about 1% of the workforce annually. But over the last three years, there has been an average of only 54,000, with less than 0.1% of all workers participating. Just not enough workers are being organized. I have previously discussed these long term trends.
It has to be mentioned that there are also voluntary union recognitions that don’t go through the NLRB election process and are therefore not included in the data. Attempts are ongoing to collect this data from the NLRB, since it is usually notified of these recognitions. The latest data indicates that in 2021 there were 127 bargaining unit recognitions covering almost 10,000 workers.
Strikes
There have traditionally been two publicly available sets of strike data provided by the federal government. The one that gets the most attention is the BLS annual report on Work Stoppages. These are strikes or lockouts involving at least 1,000 workers for at least one shift, but they are mostly strikes. For 2021, BLS reports that there were 16 large strikes that started that year.
In 2021, there were 16 major work stoppages beginning in the year, the U.S. Bureau of Labor Statistics reported today… There were 80,700 workers involved in major work stoppages that began in 2021.
As with most labor data, the number of annual strikes has been falling for many decades. There was some excitement in 2018 and 2019 when large strikes went up to 20 and 25, led by the many education strikes. There was some loose talk of a new “strike wave.” Perhaps I may have made that claim. But then the number dropped back to eight in 2020. Then in 2021 there was excited commentary about #Striketober, which I also participated in, because we got excited about the John Deere, Kellogg’s and other major strikes. But we only have 16 for the year. Here’s the trend below of the average number of annual large work stoppages and workers in each decade (with the 2020s = 2020, 2021), and we can see the incredible fall.
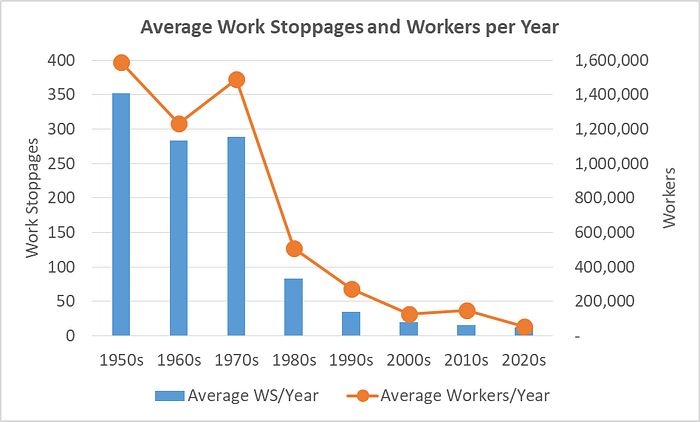
The 1950s had an average of 352 large work stoppages per year involving 1.6 million workers. Incredibly, the entire time period from the 1950s-1970s had over 300 large work stoppages per year on average (nearly one per day!) involving over 1.4 million workers annually. However, the 2010s only had an average of about 15 per year involving 150,000 workers. The huge drop in the 1980s happened in the era of the failed PATCO strike, leading to the term “PATCO Syndrome,” describing unions’ fear of striking and losing.
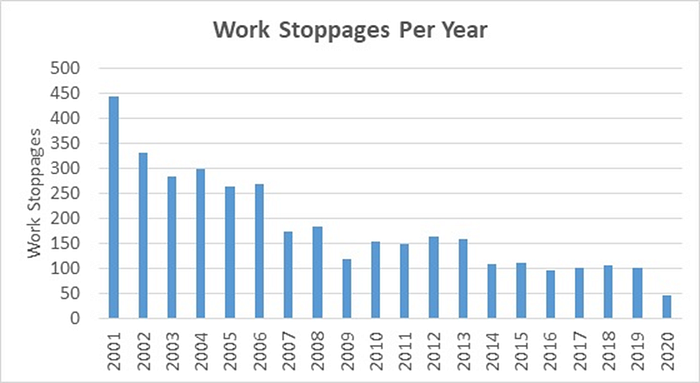
Other strike data has been collected by the Federal Mediation and Conciliation Service (FMCS), which is an agency that was formed out of the anti-union Taft-Hartley bill of 1947 to settle labor disputes and prevent strikes. It used to have monthly Work Stoppages reports which cover all the work stoppages that ended each month arising from private sector contract negotiations, and again these are mostly strikes. It also has an occasional public sector strike where it was asked to mediate. I have more information about this data here. So these aren’t all the strikes that happen, but looking at this data over time is another interesting indicator of strike activity. I say the FMCS “used to have” this data, because it mysteriously disappeared from the website around the time President Biden took office, and I have never heard why that happened. Here are the number of work stoppages from the last few decades, which I posted last year.
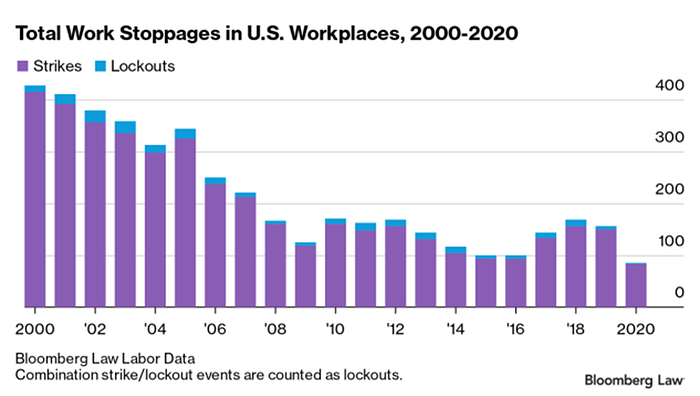
Strike data is also kept by Bloomberg Law, and is not fully available, but they do write articles based on it. It tracks strikes differently than BLS and FMCS. Here is their chart from last year:
And now we also have the Cornell-ILR Labor Action Tracker, which debuted in 2021. This much needed public resource tracks strikes and labor protests, with rigorous documentation and verification procedures. Their 2021 annual report states that there were “265 work stoppages involving approximately 140,000 workers in 2021. These 265 work stoppages resulted in approximately 3,270,000 strike days this past year.” 260 of those were strikes and five were lockouts, and it’s very interesting that about one-third of the strikes were by non-union workers. We can see how important it is to have this data, as BLS counted only 16 strikes involving 80,700 workers.
The PayDay Report Strike Tracker lists more strike activity, but there has also been a critique that many of the actions listed are not actually strikes. The AFL-CIO Strike Map has active and authorized strikes.
What Does it All Mean?
We shouldn’t draw any broad conclusions based on 2021 data. It was another unusual year due to the pandemic, which likely continued to have an impact on union membership and activity. Moreover, this data doesn’t capture the entirety of the labor movement. There are workers who are “organized” in other ways, for example through worker associations and worker centers, who are not necessarily counted in this data. That is harder to track, but it would be useful.
But the long term trends have been clear for some time, and the labor movement needs to find ways to reverse its decline. Workers are definitely interested! Unions are popular, with over two-thirds approval rating, and half of all workers want to join them! This requires a huge increase in organizing, in whatever form it takes. As an example, I have written about the Emergency Workplace Organizing Committee, which has had some success helping workers organize during the pandemic. I wrote a review of the great recent book Tell the Bosses We’re Coming, which discusses labor movement problems and possible solutions.
It’s also worth mentioning that President Biden intends to implement dozens of pro-union recommendations made in the recently released report from the White House Task Force on Worker Organizing and Empowerment. But will we get the PRO Act? In any case, the government will not save the labor movement.
I’ll end as I did last year with a few SHOUTOUTS. An essential source for weekly labor movement news, including elections and strikes, is The Week in U.S. Unions. The Daily Union Elections posts info on union elections as it arrives from the NLRB, and Union Election Data has a good summary of elections. This Labor Data site has been collecting a lot of union related data. And Confined Space posts regular reports on workplace health and safety issues.